President's Message - September 2011
Teachers Preparing for Knowledge Building Classrooms - Aligning, Curriculum, Instruction, and Assess

CONNIE QUADRINI
connie.quadrini@oame.on.ca
A Classroom Example
During a co-teaching cycle with a Grade 9 Applied Mathematics teacher, we co-planned a lesson focused on proportional reasoning. In an effort to assess students' representations of proportional thinking and repertoire of problem-solving strategies, we selected and adapted a question from the Grade 9 Applied EQAO Winter Assessment (2006), #2b.
Paul's Quilt
Paul's grandmother is sewing a quilt for him. She
asks him to cut red and white pieces. Every
5 pieces in the quilt consist of 2 red pieces and
3 white pieces. If the quilt has a total of 60 pieces,
how many pieces are there of each colour? Show
your work.
The original problem presented a quilt with a total of 300 pieces. We changed this number to 60, recognizing that this adjustment would enable students to access the problem and solve it, using a variety of tools and strategies.
In preparation for our observations and conversations with students, we considered the way in which we would assess students' thinking.
- What mathematical thinking is evident in the solutions?
- What is not clear?
- What questions, if any, should we pose to further elicit student thinking?
- What feedback might we provide?
During the lesson, I circulated as students solved the problem.
 I
observed Maria as she
created her model
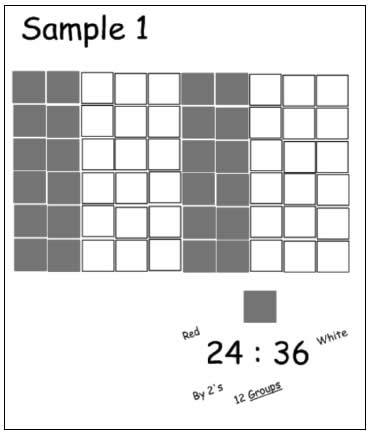
(Sample 1), using red
and white tiles. It
appeared evident from
her model that she
u n d e r s t o o d t h e
proportional relationship
(2:3) and the whole (60).
In observing Maria, I noticed that she applied her
understanding of a proportional relationship by
maintaining the proportion to generate the number of red
and white pieces. I watched her skip-count to determine
the total number of red and white pieces. Maria
represented her solution as a ratio, noting "by 2's" and
"12 groups." I asked her to share the significance of these
notes. Maria indicated that she skip counted by 2's, 12
times in order to determine the number of red pieces.
Through observations, conversations with Maria, and by
examining her product, it was evident that she had an
understanding of the proportional relationship and could
solve the problem, using concrete materials. The coteacher
and I would need to support her in further
annotating her mathematical thinking on her product.
I
observed Maria as she
created her model
(Sample 1), using red
and white tiles. It
appeared evident from
her model that she
u n d e r s t o o d t h e
proportional relationship
(2:3) and the whole (60).
In observing Maria, I noticed that she applied her
understanding of a proportional relationship by
maintaining the proportion to generate the number of red
and white pieces. I watched her skip-count to determine
the total number of red and white pieces. Maria
represented her solution as a ratio, noting "by 2's" and
"12 groups." I asked her to share the significance of these
notes. Maria indicated that she skip counted by 2's, 12
times in order to determine the number of red pieces.
Through observations, conversations with Maria, and by
examining her product, it was evident that she had an
understanding of the proportional relationship and could
solve the problem, using concrete materials. The coteacher
and I would need to support her in further
annotating her mathematical thinking on her product.
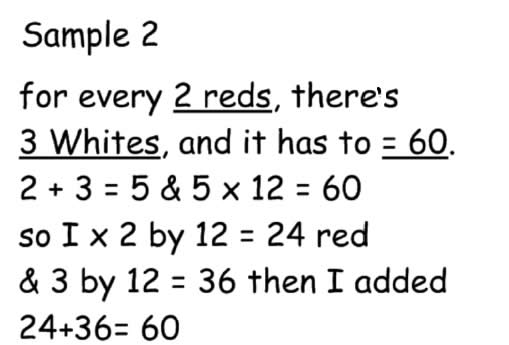
 As the co-teacher and I examined Sample 2, created
by Josh, we noticed how he used the given parts to
create a whole that would be multiplied by 12 to find the
total number of pieces in the quilt. This scale factor was
used to determine the number of red and white pieces in
the quilt. Clearly, Josh's solution exposed his
proportional reasoning.
 As Hakim worked, the co-teacher and I watched as
he used the parts given in the problem to create a
fraction 2/3 (Sample 3). I wondered whether he would
make the common error of comparing this fraction with a
fraction involving the whole. To our surprise, we watched
as Hakim created equivalent fractions. In my zeal to
understand Hakim's thinking, I ask him, "Tell me about
your strategy." He proceeded to describe his "test and
check" method that had him use easy numbers to
multiply by to find the right total. This systematic trialand-
error strategy, unbeknownst to Hakim, enabled him
to find the scale factor, and then solve the problem. As
teachers, we knew that we would have to address the
precision in mathematical form in his solution and agreed
that the discussion would focus on the concept of
equality.
During our Consolidation, we took the opportunity to have students compare and contrast their solutions. Students quickly identified commonalities across the solutions. They saw the parts, 2 and 3, the wholes, 5 and 60, and the 12, which we named the scale factor. In prompting students to find the 12 in the model from Sample 1, students suggested that we rearrange the 6 x 10 array to form a 12 x 5 array so that the scale factor would be easily seen. We introduced the concept of variable as a placeholder for the unknown number of pieces of, for example, red pieces. We also introduced a proportion equation, , and asked students to identify the similarities and differences between this representation and the representations presented in the student solutions. Students made connections with ease, once again, identifying parts and wholes, and determined the scale factor, which would then be used to find x = 24.
Using Assessment for Learning to Inform Instruction
During the co-debrief, the co-teacher and I discussed the mathematical thinking that was evident within the solutions and how our observations and conversations with students opened the window to students' understanding of proportional relationships. Through further deconstruction and analysis of the solutions, we discussed next steps for instruction which, for some, included formalizing the mathematical thinking that was shared during conversations, for others, precision in communicating mathematical thinking, and for the entire class, further supporting students in generalizing a proportional relationship using an equation. The next day's lesson would then provide students with an opportunity to use an elastometer to further develop conceptual understanding of proportions and enable a transition to representing proportional relationships using an equation. For more information on creating and using an elastometer, visit www.edugains.ca/resources/ ProfessionalLearning/SelfDirectedPLM/ClassroomIn structionalStrategies/index.html?movieID=3..
Creating the Conditions for Success
Through observations, conversations, and products, we create the ideal conditions for uncovering what students truly understand and can do. As Fullan, Hill, and Crevola (2006) suggest, "Assessment for learning is information gathered today about what needs to be done tomorrow," so let us "prepare our eyes to see, ears to hear" and voice to respond.
References
Assessment Reform Group. (2002). Assessment for learning: 10 principles. Retrieved from www.assessment-reformgroup. org
Fullan, M., Hill, P., & Crevola, C. (2006). Breakthrough. Thousand Oaks, CA: Corwin.
Ontario Ministry of Education. (2010). Growing success: Assessment, evaluation, and reporting in Ontario schools – First edition, covering grades 1 to 12. Toronto: Queen's Printer for Ontario.
Ontario Ministry of Education, Literacy and Numeracy Secretariat. (2005). Coaching institute for literacy and numeracy leaders. Toronto: Queen's Printer for Ontario.
Previous Message:
A Focus on Professional Learning Keeping Inquiry at the Heart
Next Message:
Using Rich Assessment Tasks


 Like us on FaceBook